The topics in this section describe various types of Geo Point Map dashboard items that allow you to place callouts, bubbles or pies on the map using geographical coordinates.
The dashboard supports three types of Geo Point maps:
-
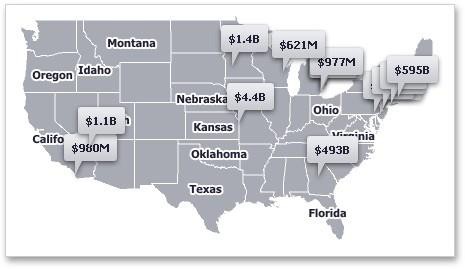
The Geo Point Map dashboard item allows you to place callouts on the map using geographical coordinates.
-
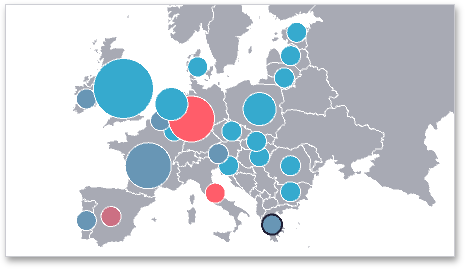
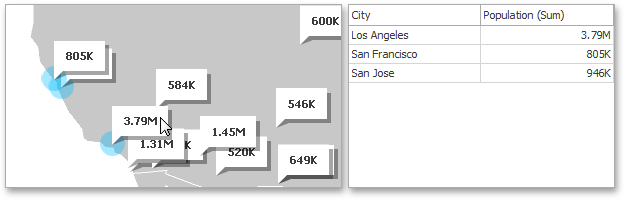
The Bubble Map dashboard item allows you to place bubbles on the map. Each bubble can represent data via its weight and color.
-
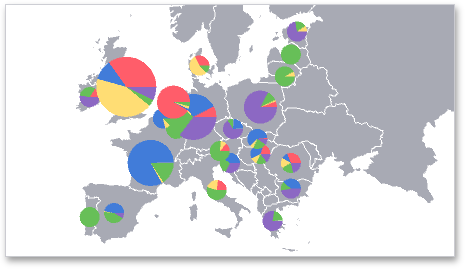
The Pie Map dashboard item allows you to display pies on the map. Each pie visualizes the contribution of each value to the total.
Map Zooming and Scrolling
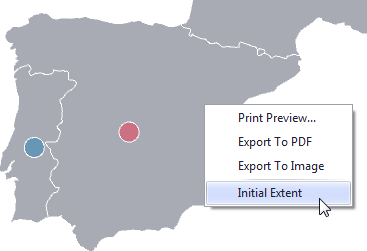
You can use the mouse wheel to change the current zoom level for a map. To scroll the map, hold down the left mouse button and drag it.
To move to the initial zooming and scrolling state, click the Initial Extent menu item in the map's context menu.
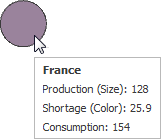
A Geo Point Map dashboard item can display a tooltip that shows information on a hovered callout/bubble/pie.
Map Types Overview
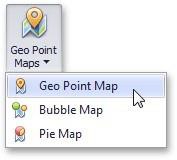
The Dashboard Designer allows you to create three types of Geo Point maps.
The Geo Point Map dashboard item allows you to place callouts on the map using geographical coordinates.
The Bubble Map dashboard item allows you to place bubbles on the map. Each bubble can represent data using its weight and color.
The Pie Map dashboard item allows you to display pies on the map. Each pie visualizes the contribution of each value to the total.
To create the required Geo Point Map dashboard item, use the Geo Point Maps button in the Home ribbon tab.
Providing Maps
This document explains how to use the BI Dashboard maps or provide custom maps.
Default Maps
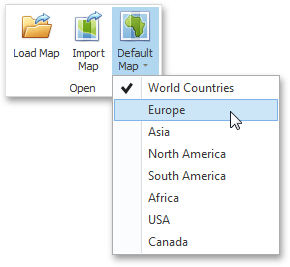
The BI Dashboard contains a set of default maps showing various parts of the world. The following maps are included:
-
World Countries
-
Europe
-
Asia
-
North America
-
South America
-
Africa
-
USA
-
Canada
NOTE: The World Countries map has a lower level of detail than maps of specific regions and may not contain some countries. As an alternative, you can load a custom map with the required granularity.
To select the default map, use the Default Map button in the Design ribbon tab.
As an alternative, use the corresponding command in the map's context menu.
Custom Maps
A Shapefile vector format to provide custom maps. Commonly, this format includes two file types:
-
.shp file - holds map shapes (points/lines/polygons).
-
.dbf file - contains attributes for each shape.
To open an existing shapefile, use the Load Map or Import Map button in the Ribbon, or the command in the context menu.
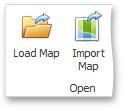
If the map is opened using the Load Map button, the dashboard XML definition will contain the path to a map shapefile. If the map is opened using the Import Map button, the dashboard XML definition will contain the map itself.
Geo Point Map
The Geo Point Map dashboard item allows you to place callouts on the map using geographical coordinates.
Providing Data
This topic describes how to bind the Geo Point Map dashboard item to data using the Dashboard Designer.
The Dashboard Designer allows you to bind various dashboard items to data in a virtually uniform manner. The only difference is in the data sections that these dashboard items have.
The image below shows a sample Geo Point Map dashboard item that is bound to data.
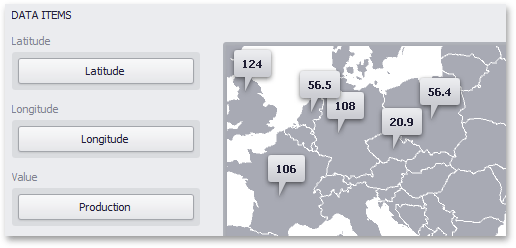
Note that the Geo Point Map provides two data item groups for data binding: Data Items and TOOLTIP Data Items. Tables below list the available data sections.
Data Items
| Section | Description |
|---|---|
|
Latitude |
Accepts a dimension used to provide geographic latitude. |
|
Longitude |
Accepts a dimension used to provide geographic longitude. |
|
Value |
Accepts values related to geographic points. These values are displayed within map callouts. |
Tooltip Data Items
| Section | Description |
|---|---|
|
Dimensions |
Accepts dimensions allowing you to add supplementary content to the tooltips. |
|
Measures |
Accepts measures allowing you to add summaries to the tooltips. |
Interactivity
This document describes the capabilities that enable interaction between Geo Point maps and other dashboard items. These capabilities include Master Filtering.
Master Filtering
The Dashboard allows you to use any data aware dashboard item as a filter for other dashboard items (Master Filter).
When Master Filtering is enabled, you can click a callout/bubble/pie (or multiple callouts/bubbles/pies by holding down the CTRL key) to make other dashboard items only display data related to the selected callout(s)/bubble(s)/ pie(s).
You can also select multiple callouts/bubbles/pies in the following way.
-
Hold the Shift key and the left mouse button
-
Drag the mouse pointer, to mark an area that includes the desired elements
-
Release the left mouse button. All elements within the area will be selected
To reset filtering, use the Clear Master Filter button (the  icon) in the Map's caption area, or the Clear Master Filter command in the context menu.


